• We're currently having issues with our e-mail system. Anything requiring e-mail validation (2FA, forgotten passwords, etc.) requires to be changed manually at the moment. Please reach out via the Contact Us form if you require any assistance.

SynthV Studio Saki AI vs. Sample Rates – A multi-part investigation...

inactive

Passionate Fan
Jun 27, 2019
179
Background:

I normally export from SynthV using a 24-bit sample depth and a 44.1 kHz sample rate. There are two reasons for this. First, it’s good practice to work with 24-bit source files, even when the final mix will be 16-bit. Second, I’m interested in uploading to YouTube, which uses a 44.1 kHz sample rate and will resample any audio that does not conform.

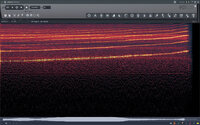
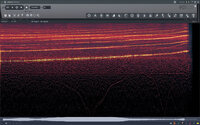
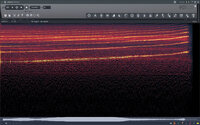
In addition to the above, I’ve often felt that SynthV voicebanks have “harsh” overtones, especially when singing higher notes. Unfortunately, this problem seems to have been carried over to Saki AI. In an attempt to solve the problem, I recently tried exporting Saki AI at 96 kHz instead of my more usual 44.1 kHz, and the result was a less harsh-sounding audio file.

As a result of my above experience, I now export at 96 kHz and then downsample to 44.1 kHz in Audacity using its highest setting.

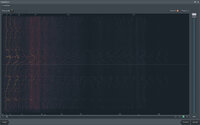
However, I have also discovered that not only does SynthV Studio have a selectable export sample rate, it also has a selectable internal engine sample rate. This can be found by clicking on the cog wheel icon then scrolling down in the “cog” menu until the “Engine Sample Rate” option is visible.

If you try this, remember to click “Restart Live Rendering System” to implement your changes. And if the scroll bar is not visible, hover the cursor over top where you think it should be and it will appear. SynthV Studio hides scroll bars when not in use, which is why some features may evade new users.

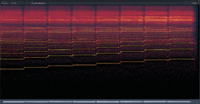
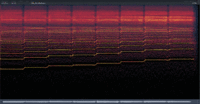
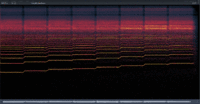
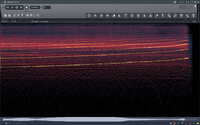
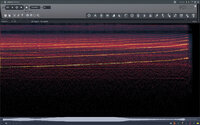
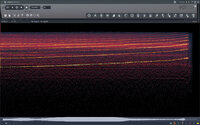
After discovering this “Engine Sample Rate” option, I decided to do some experiments. The results are as follows:
 

inactive

Passionate Fan
Jun 27, 2019
179
Below is an animated GIF that swaps between two spectrograms of two different 24-bit samples. It was created using Edison and GIMP.

Sample A:
  • SynthV internal engine set to 44.1 kHz
  • 44.1 kHz native export.
Sample B:
  • SynthV internal engine set to 44.1 kHz.
  • 96 kHz export.
  • Downsampled to 44.1 kHz in Audacity using highest-quality settings.

44k_comparison.gif

What you are looking at:
The above spectrograms show a C-major scale rendered with Saki AI using a random Auto Pitch Tuning seed and Improvisation set to 0.50. The scale begins at the left and progresses diatonically to the right: C4 > D4 > E4 > F4 > G4 > A4 > B4 > C5

Audio frequencies increase from top to bottom, with the very bottom indicating 0 Hz and the very top indicating 22050 Hz. This upper limit is determined by the Nyquist frequency, which is exactly half of the 44.1 kHz sample rate. The brighter the frequency component, the louder its amplitude. Dark sections represent an absence of frequency information.

The frequency is plotted logarithmically.

Observations:
  • There is a change in brightness between the two spectrograms.
  • The brighter spectrogram represents Sample A.
  • The darker image represents Sample B.
A large percentage of this brightness change occurs in a horizontal band near the top, and it seems mostly immune to note changes. The very top of this band is inaudible to humans, but its lower frequency is at ~15 kHz, which is audible. (Remember, the frequency is plotted logarithmically, so 15 kHz is found near the top of the spectrogram.)

Differences in brightness do continue down below 15 kHz, but they become less and less noticeable as the frequency lowers.

On Sample B, at approximately 15.6 kHz, there is a continuous horizontal line across the notes of G4, A4, and B4. This was generated by SynthV’s 96 kHz export, not Audacity’s sample rate converter.

In my opinion, Sample A sounds harsher than Sample B, especially as the notes climb higher.
 
Last edited:

inactive

Passionate Fan
Jun 27, 2019
179
Below is an animated GIF that swaps between two spectrograms of two different 24-bit samples. It was created using Edison and GIMP.

Sample C:
  • SynthV internal engine set to 96 kHz.
  • 44.1 kHz native export.
Sample D:
  • SynthV internal engine set to 96 kHz.
  • 96 kHz export
  • Downsampled to 44.1 kHz in Audacity using highest-quality settings.

96k_comparison.gif

What you are looking at:
The above spectrograms show a C-major scale rendered with Saki AI using a random Auto Pitch Tuning seed and Improvisation set to 0.50. The scale begins at the left and progresses diatonically to the right: C4 > D4 > E4 > F4 > G4 > A4 > B4 > C5

Audio frequencies increase from top to bottom, with the very bottom indicating 0 Hz and the very top indicating 22050 Hz. This upper limit is determined by the Nyquist frequency, which is exactly half of the 44.1 kHz sample rate. The brighter the frequency component, the louder its amplitude. Dark sections represent an absence of frequency information.

The frequency is plotted logarithmically.

Observations:
  • There is a subtle change in brightness between the two spectrograms.
  • The darker image represents Sample C.
  • The brighter image represents Sample D.
On Sample C, at approximately 15.6 kHz, there is a continuous horizontal line across the notes of G4, A4, and B4. This was generated by SynthV’s 96 kHz export, not Audacity’s sample rate converter.

In my opinion, Sample D sounds subtly harsher than Sample C, however, Sample C is still harsher than Sample B.
 
Last edited:

inactive

Passionate Fan
Jun 27, 2019
179
Below is an animated GIF that swaps between two spectrograms of two different 24-bit samples. It was created using Edison and GIMP.

Sample E:
  • SynthV internal engine set to 44.1 kHz.
  • 96 kHz native export.
Sample F:
  • SynthV internal engine set to 96 kHz.
  • 96 kHz native export.
Audacity was not used for these examples.

96k_native_comparison.gif

What you are looking at:
The above spectrograms show a C-major scale rendered with Saki AI using a random Auto Pitch Tuning seed and Improvisation set to 0.50. The scale begins at the left and progresses diatonically to the right: C4 > D4 > E4 > F4 > G4 > A4 > B4 > C5

Audio frequencies increase from top to bottom, with the very bottom indicating 0 Hz and the very top indicating 48000 Hz. This upper limit is determined by the Nyquist frequency, which is exactly half of the 96 kHz sample rate. The brighter the frequency component, the louder its amplitude. Dark sections represent an absence of frequency information.

The frequency is plotted logarithmically.

Observations:

Sample E fills the entire spectrum from top to bottom, while Sample F leaves an empty black band across frequencies from ~23 kHz to 48 kHz. Not only are these missing frequencies ultrasonic, but they also cannot be stored using a 44.1 kHz sample rate. Of course, both samples were exported at 96 kHz, but one was generated with an engine sample rate of 44.1 kHz and the other with an engine sample rate of 96 kHz. Surprisingly, the spectrum is filled when the engine runs internally at 44.1 kHz, and it only half-fills when running internally at 96 kHz. This is perhaps the opposite of what one might expect.

Well, to be perfectly correct, the 96 kHz engine sample rate does generate some frequency information in the 23 kHz to 48 kHz band. If you look carefully at the G4 note in the Sample F spectrogram you can see some swirling patterns high above. I have no idea what they are, and I can’t hear them because I’m not a bat.

Overall, the audio is less bright/harsh when the engine runs at 44.1 kHz internally, but that mysterious line always appears at ~15 kHz.

Bonus:
Is it me or are the ultrasonic frequencies in Sample E a mirror image of the audible frequencies? Time for further investigation!
 

inactive

Passionate Fan
Jun 27, 2019
179
The image below is Sample E as viewed in Edison’s EQ editor. I’m using the EQ function not because I want to EQ the waveform, but because I can use it to change the frequency-plotting scale. However, it rotates the waveform ninety-degrees clockwise.

eq_view.jpg

What you are looking at:
The above spectrograms show a C-major scale rendered with Saki AI using a random Auto Pitch Tuning seed and Improvisation set to 0.50. The scale begins at the top and progresses diatonically to the bottom: C4 > D4 > E4 > F4 > G4 > A4 > B4 > C5

Audio frequencies increase from left to right, with the very left indicating 0 Hz and the very right indicating 48000 Hz. This upper limit is determined by the Nyquist frequency, which is exactly half of the 96 kHz sample rate. The brighter the frequency component, the louder its amplitude. Dark sections represent an absence of frequency information.

The frequency is plotted... linearly? I think...? Or at least it’s pretty close.

Observations:
The middle of the screen is roughly 22050 Hz, which is the Nyquist frequency of 44.1 kHz. Yes, this is a 96 kHz sample, but there does seem to be some sort of division at 22050 Hz. If you examine the overtone wiggles to the left of this division and then look to the right, you will find a ghostly mirror-image of the overtones hiding in the ultrasonic region. Is SynthV flipping the audio at 44.1 kHz Nyquist, even when exporting at 96 kHz?

I decided to investigate even further...
 

inactive

Passionate Fan
Jun 27, 2019
179
The image immediately below is new 96 kHz sample exported natively from SynthV with the internal engine set to 44.1 kHz. It is being viewed in Edison’s EQ editor.

crazy_eq_view.jpg

What you are looking at:
The above represents a single C6 note with some crazy pitch bends created by drawing directly into Synth V. It is rendered with Saki AI and no Auto Pitch Tuning. I used a higher pitch just to see what would happen if the overtones crossed 22050 Hz.

Audio frequencies increase from left to right, with the very left indicating 0 Hz and the very right indicating 48000 Hz. This upper limit is determined by the Nyquist frequency, which is exactly half of the 96 kHz sample rate. The brighter the frequency component, the louder its amplitude. Dark sections represent an absence of frequency information.

The frequency plotting is linear...? I'm pretty sure it's linear.

Observations:

The audible frequencies are clearly mirrored in the ultrasonic frequencies. I have no idea why. Although I must say that it looks kinda neat! Or a mess, depending upon your personal taste.
 

inactive

Passionate Fan
Jun 27, 2019
179
Exciting action-packed update!

I did a bit more messing around with SynthV Studio’s sample rates, this time setting the internal engine to 44.1 kHz, 48 kHz, and 96 kHz, and then rendering each at 44.1 kHz, 48 kHz, and 96 kHz.

Part 1 of 4
44.1 kHz export

All three spectrograms immediately below show a file rendered at 44.1 kHz. Frequencies are plotted linearly. The voicebank is Saki AI and the test project features an upward pitch-bend of an ungodly high note. This particular test was specifically designed to exaggerate any potential problems. The top of the X-axis represents 22050 Hz (Nyquist) and the bottom is effectively 0 Hz.

Engine at 44.1 kHz:
44 engine - 44 export.jpg

Engine at 48 kHz:
48 engine - 44 export.jpg

Engine at 96 kHz.
96 engine - 44 export.jpg

The best 44.1 kHz export quality occurs when the engine is also set to 44.1 kHz (top image).

The second-best 44.1 kHz export quality occurs when the engine is set to 96 kHz (middle image). However, the exported file exhibits noticeable foldback distortion (aliasing), which occurs when frequencies above Nyquist are reflected back into the audible range. Furthermore, near the bottom righthand corner there appears to be a single upper partial that folds so far back that when it hits 0 Hz, it begins to fold forward. Or at least I think that’s what’s happening—I could be wrong. Nevertheless, a 96 kHz engine-setting exported at 44.1 kHz is messy.

The worst 44.1 kHz export quality occurs when the engine is set to 48 kHz. Not only is the spectrogram even messier than the 96 kHz engine setting, along the bottom you can also see what appears to be two instances of forward folding. Yikes!

Conclusion: If you want to export at 44.1 kHz, then set the internal engine to 44.1 kHz. Unfortunately, when I first installed SynthV Studio Pro the installation defaulted to a 48 kHz engine, yet I always exported at 44.1 kHz for YouTube reasons. No wonder I was getting such awful-sounding results.
 

inactive

Passionate Fan
Jun 27, 2019
179
Part 2 of 4
48 kHz export

All three spectrograms immediately below show a file rendered at 48 kHz. Frequencies are plotted linearly. The voicebank is Saki AI and the test project features an upward pitch-bend of an ungodly high note. This particular test was specifically designed to exaggerate any potential problems. The top of the scale represents 24 kHz (Nyquist) and the bottom is effectively 0 Hz.

Engine at 44.1 kHz:
44 engine - 48 export.jpg

Engine at 48 kHz:
48 engine - 48 export.jpg

Engine at 96 kHz:
96 engine - 48 export.jpg

The best 48 kHz export quality occurs when the engine is set to ... 96 kHz? I think so. But 48 kHz is also pretty good.

The worst 48 kHz export quality occurs when the engine is at 44.1 kHz. All you get is a messy criss-cross of partials!

Conclusion: If you want to export at 48 kHz, set the internal engine to either 48 kHz or 96 kHz, although the latter might be a teensy-weensy bit cleaner.
 

inactive

Passionate Fan
Jun 27, 2019
179
Part 3 of 4
96 kHz export

All three spectrograms immediately below show a file rendered at 96 kHz. Frequencies are plotted linearly. The voicebank is Saki AI and the test project features an upward pitch-bend of an ungodly high note. This particular test was specifically designed to exaggerate any potential problems. The top of the scale represents 48 kHz (Nyquist) and the bottom is effectively 0 Hz.

Engine at 44.1 kHz:
44 engine - 96 export.jpg

Engine at 48 kHz:
48 engine - 96 export.jpg

Engine at 96 kHz:
96 engine - 96 export.jpg

The worst 96 kHz export quality occurs when the engine is set to 44.1 kHz. In addition to aliasing, frequency folding appears in the ultrasonic range. You can’t hear the ultrasonic folding (unless you’re a bat), but its existence can be indicative of sample-rate conversion issues.

The best 96 kHz export quality occurs when the engine is set to ... 48 kHz? 96 kHz? I dunno. They’re both pretty similar. The only difference is that the folded ultrasonic frequencies have been cut off when the engine is set to 96 kHz. Where did they go?

Conclusion: If you want to export at 96 kHz, set the internal engine to either 48 kHz or 96 kHz. Having said that, the audible range is ever-so-slightly cleaner when the engine is set to 48 kHz, but then you get a boatload of unwanted ultrasonic frequencies.
 

inactive

Passionate Fan
Jun 27, 2019
179
Part 4 of 4
Final conclusion

Modern sample-rate conversion algorithms should not exhibit the problems shown in the above spectrograms. But it is an issue with SynthV Studio (v1.2.2), so please be aware of your settings when exporting.

As for myself, going forward I will set the internal engine to 48 kHz, then render at 96 kHz, and finally downsample the rendered audio file to 44.1 kHz using Audacity’s highest quality setting. (Audacity’s samplerate conversion is quite clean, although iZotope is apparently better.)

Have fun!
 

Users Who Are Viewing This Thread (Users: 0, Guests: 1)